


Hashrate and temperature charts in AsicBoost firmware
Charts: telling a one off glitch from a systemic problem
Widgets show the moment, charts show the history. They are what tells you whether it was always like this or started last night.
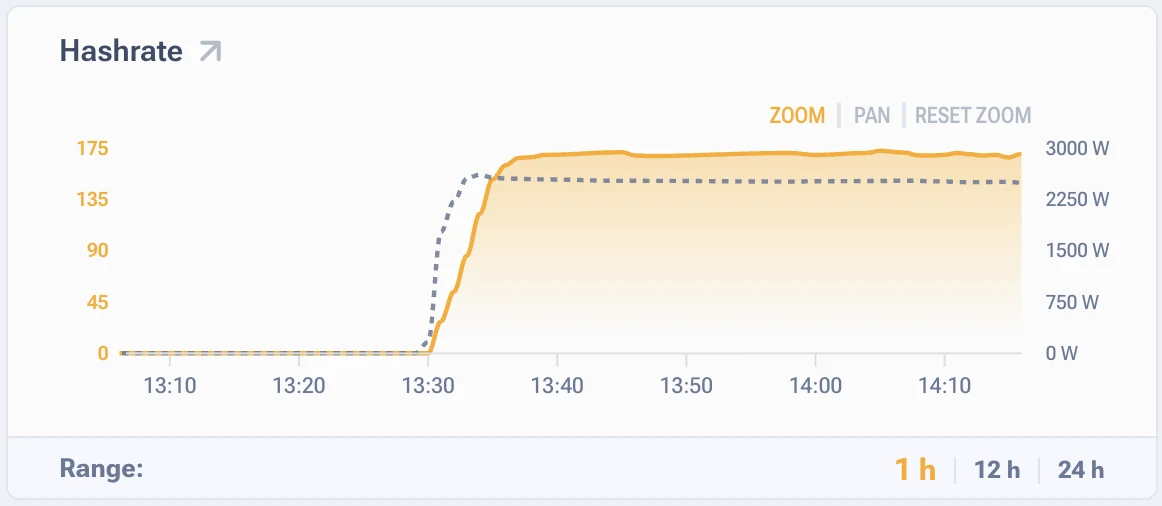
The hashrate chart
A flat line with a bit of noise is normal. What else happens:
| Shape of the curve | Usual cause |
|---|---|
| A step down and flat after that | A hash board dropped out or the profile went lower |
| A sawtooth with an even period | Automatic profile switching by temperature is working |
| Drops to zero with recovery | Mining restarts, check the logs |
| A slow slide over hours | The room is heating up, temperature rises, frequency drops |
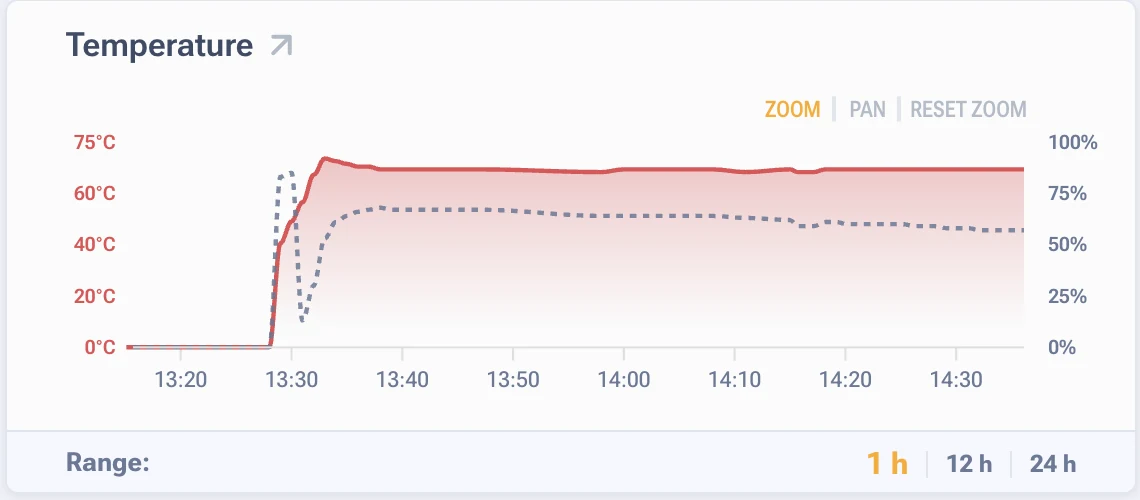
Temperature and fan load chart
It carries two values: temperature in degrees and fan load in percent, fan duty. They have to be read together, on their own they give little.
- Temperature flat, fan duty flat. All in order.
- Temperature flat, fan duty creeping up. Heat transfer is getting worse: dust, dried out thermal paste, a fan losing strength. The first sign, visible weeks before the problem.
- Fan duty at 100% and temperature still rising. Cooling is used up. Lower the profile or sort out the air intake.
- A sharp temperature spike on one stretch. Most often a faulty sensor, especially on models that measure per chip.
The state of each fan on its own is visible in the cooling table, along with statuses and speeds.
Interval and depth of history
The chart interval depends on the firmware version and the interface settings. The history itself lives in the controller memory and is wiped on a full reboot, so an empty chart after a reboot is normal. If you need history over weeks and months, pull the data out through the API into a monitoring system.
The chart tells you when it started. Look for the cause in the logs for the same stretch of time.