

Hash board table on the firmware dashboard
Board table: where to look for a hardware problem
If the widgets at the top say something is off, the answer is almost always here. Look at the difference between the boards, not at the absolute numbers.
| Column | What it shows |
|---|---|
| Hashrate | Hashrate of the board |
| Errors | Board errors, in H/s or percent |
| Temperature | Board temperature |
| Frequency | Current frequency |
| Voltage | Voltage |
| Consumption | Power draw of the board |
| Chip status | State of the chips, for example All chips are good |
Comparison beats absolute values
Three boards put out 42 TH/s each, the fourth one 31 TH/s. No theory is needed here, the fourth is the one to look at. Same with temperature and errors: a clear deviation on one board almost always has a hardware cause.
- Lower hashrate, higher errors. Some chips do not hold the frequency or have degraded.
- Lower hashrate with normal errors. The firmware lowered the frequency of that board itself to keep it stable. That is normal behaviour, not a fault.
- Higher temperature at the same airflow. Thermal paste, heatsink clamping, position of the board in the air stream.
- A board dropped out of the list. Ribbon cable, power, or the protection tripped. Check the logs.

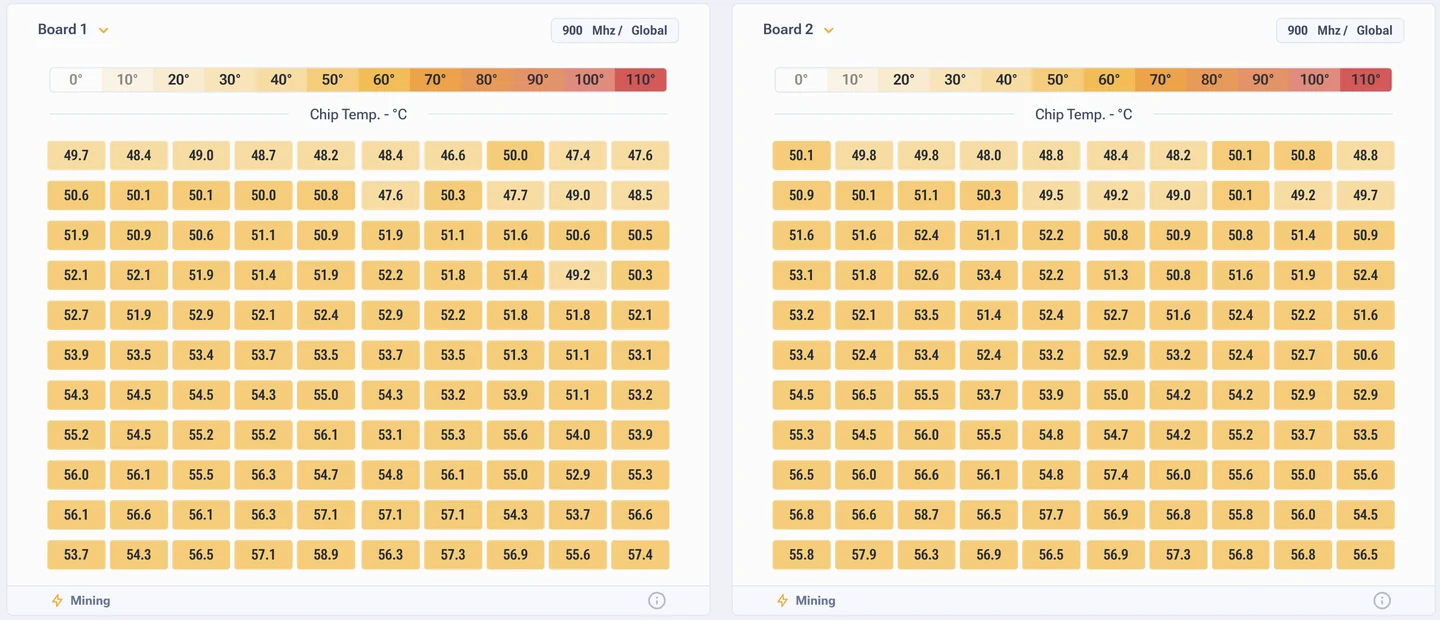
Chip Map and Heat Map
Chip Map shows the state of every chip on the board, Heat Map colours the board by temperature. Together they answer one question: is the problem spread over the board or gathered in one corner.
A local hot spot usually means mechanics: uneven heatsink clamping, dried out thermal paste, a blocked air stream. A board that is hot all over is a question of the profile and of general cooling.