


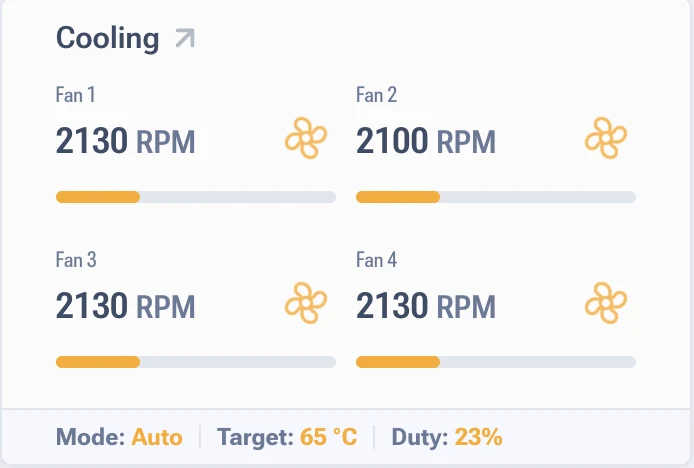
Cooling table on the firmware dashboard
Cooling table: speed, PWM and fan statuses
Four rows, one per fan. Enough to tell in five seconds whether the airflow is alive.
| Column | What it shows |
|---|---|
| Fan number | Fan index: Fan 1, Fan 2 and so on |
| RPM | Actual speed from the tachometer |
| Fan Duty | Requested PWM level in percent |
| Status | OK, Error, Stopped or Disabled |
What counts as normal
- Speeds on all fans are close, a spread up to 10% is fine.
- Fan duty is the same on all of them, because the firmware drives them together.
- High fan duty at a calm temperature means either an aggressive cooling profile or heat transfer that has got worse.
- Zeros in RPM with a non zero fan duty is already a fault, even if the status has not switched yet.
Error status, what to do
- Check the connector on the board and on the fan itself. The most common cause is in the first step.
- Look the fan over: has it jammed, is anything catching the impeller.
- Check the cable along its whole length, especially where it bends.
- Reboot the ASIC. A one off glitch in the tachometer polling does happen.
- If the error stays, replace the fan. Running on three fans out of four is possible for a short while and only with the temperature under watch.
Why this is urgent
A failed fan raises chip temperature, the firmware cuts frequencies, and at the critical
threshold it stops mining altogether. A day of work with a dead fan costs more
than a new fan.
There is a separate case, when the tachometer lies and the fan is spinning. Then the minimum fan count parameter in the cooling section helps: it lets you keep running without switching the protection off completely.
Quick answers
The ASIC is in immersion and the table shows fan errors.
Turn on immersion mode in the cooling section, then fan monitoring is switched off and hardware dummies are not needed.
Fan duty 100% around the clock, is that normal?
No. Either there is not enough cold air coming in, or the profile is too heavy for the current conditions.