


Navigating the AsicBoost firmware web interface
How the interface is laid out and where things are
Five minutes on this page will save you half an hour of clicking around. The interface is logical, but some of the names are not obvious.
Left menu
| Section | What is inside |
|---|---|
| Dashboard | The main screen: 5 widgets on top, charts and 3 tables below |
| Mining | Pools, cooling, performance, advanced |
| System | general settings and backup, security, network |
| Technical support | Diagnostic report and contacts |
| API | Keys and access settings for external systems |
| Update center | Uploading the firmware file and updating |
The update center button sits at the very bottom of the menu. On a narrow screen the menu collapses and opens again from the three bar icon. The interface language is not switched here but in quick actions, the gear icon in the top bar, and it applies right away.
The top bar with restart, lock and quick actions has its own page, the section on the control buttons.
What the main screen is made of
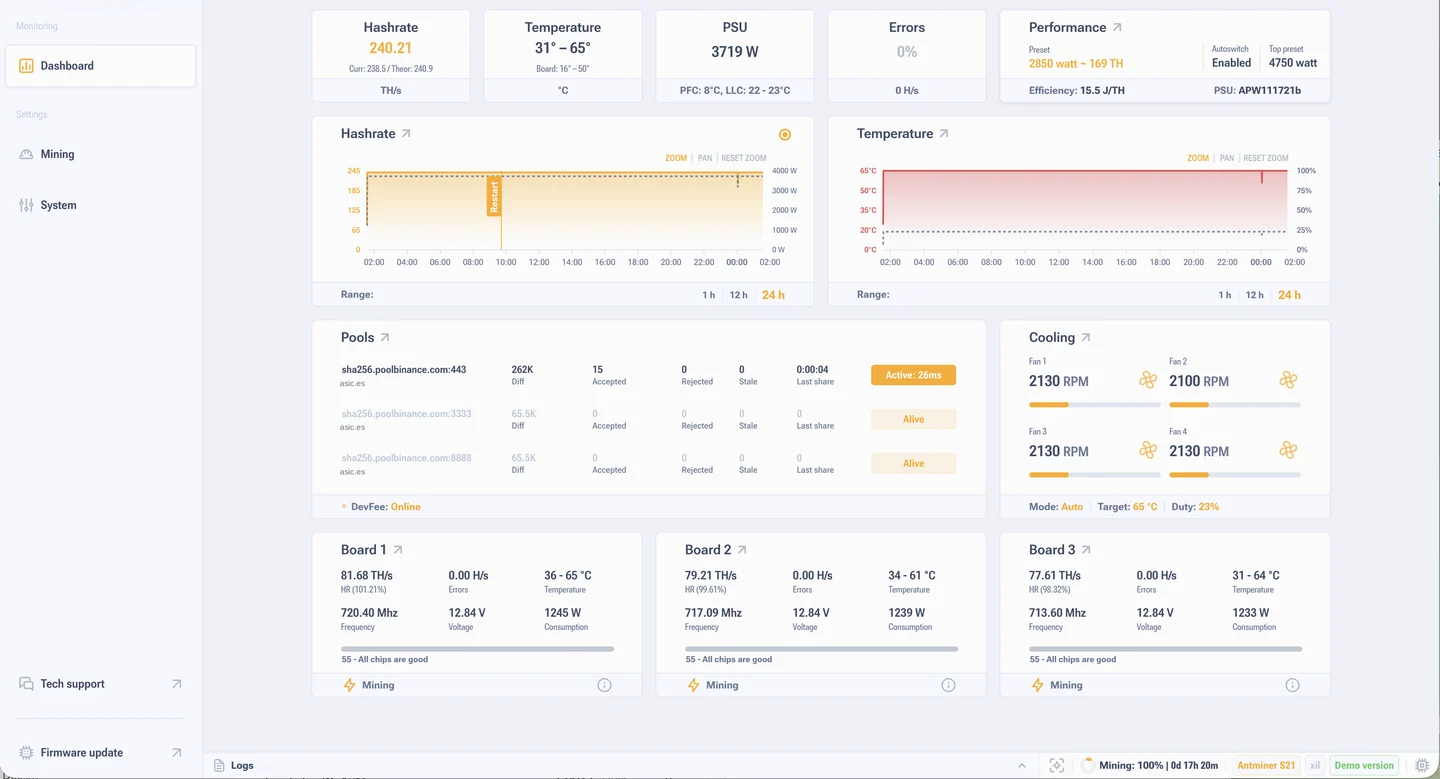
A row of widgets on top: hashrate, temperature, power draw, errors, performance. That is an instant snapshot of the state.
Below that are the hashrate and temperature charts. They answer the question "has it always been like this or did it just start".
Three tables sit lower: pools, cooling and boards. This is where you get the detail on every pool, every fan and every hash board.
At the bottom is the status bar with the mode, uptime, model and version.
What order to read it in
- Status bar. Is the ASIC mining at all, or sitting in autotuning, initialization, a pause.
- Hashrate widget. Is the current value close to the theoretical one or clearly below it.
- Errors widget. A percentage above the usual means the chips are running at their limit.
- Temperature and the cooling table. Fans alive, RPM steady.
- Boards table. If one board stands out from the rest, that is the one to look at.
- Logs. When the widgets tell you nothing, the answer is usually there.
One general note about the top widgets: they show instant values, so they jump. Before you draw conclusions from a single number, look at the chart over a few hours.